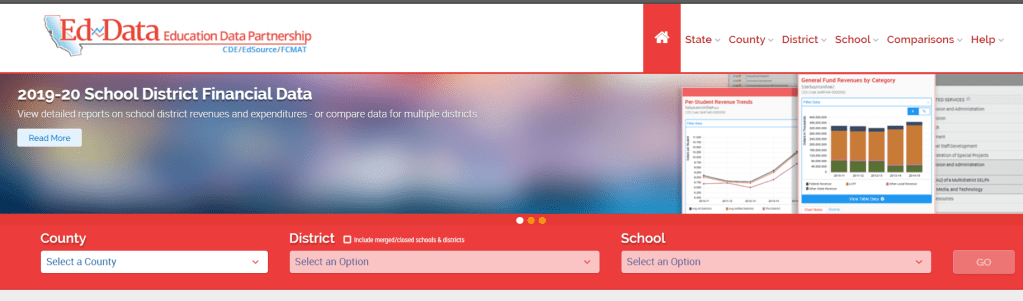
In order to understand how your local school district is funded, it’s helpful to look at a breakdown of different revenue sources. One the easiest tools for this is https://www.ed-data.org/
From the Ed Data web site, you can use the pulldown menus to search for your district or even individual schools:
Once you click GO to see your results, scroll down and select the Financial Data tab. For example, here is the Pacifica School District in San Mateo County:
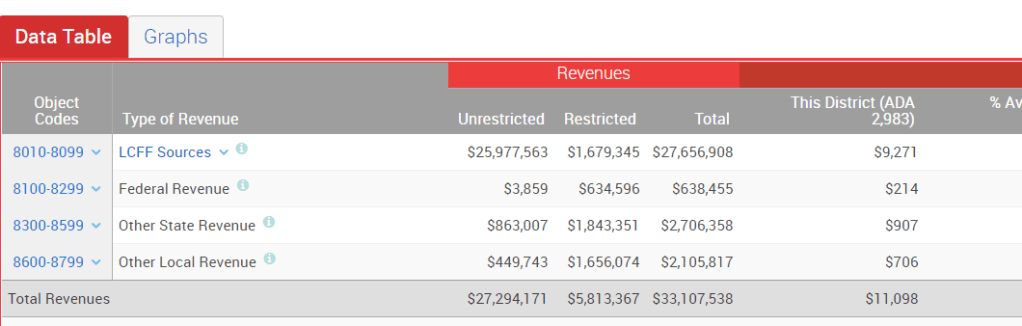
Under This District you can see the list of each revenue source in per student (ADA) dollars. Click on a blue ! for a description of each revenue source. If you click on LCFF Sources, you will get an expanded list:
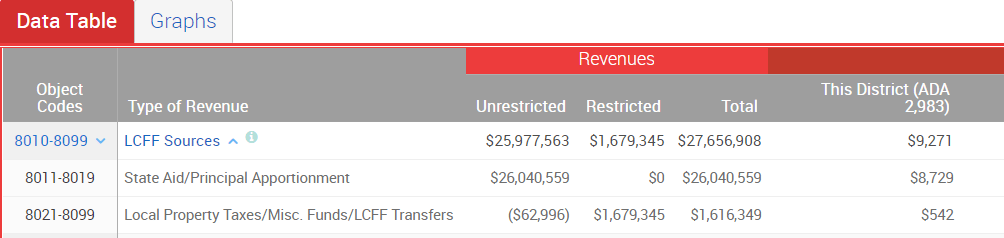
The State Aid amount ($8,729) is the base amount per student allocated to the district according to the Local Control Funding Formula. You can see a further breakdown by clicking on the object code (8011-8099):

Click on an orange ? to see an explanation of each fund.
The list of revenue sources can be a little overwhelming, but in general, you can see that in the case of the Pacifica School District, the basic amount allocated for each student according to the Local Control Funding Formula was $9271 for the 2019-2020 school year. In addition, they received $214 per student from Federal Funds (which include money allocated for special education and Title I and Title II programs to help economically disadvantaged students). They also received $907 in State Funds (which include money from the state lottery, as well as funds for special needs), and $706 in Local Funds, the majority of which comes from a local parcel tax.
Now you have an idea of how much money is being allocated for your local schools, but how much do they really need? This tool from EdSource is based on a 2018 state-wide study of how much it would cost to provide an adequate education to California Students. You can see how much higher or lower your school funding allocation would need to be to achieve adequate funding by using the pull down menu to find your School District.
Here are the results for Pacifica:
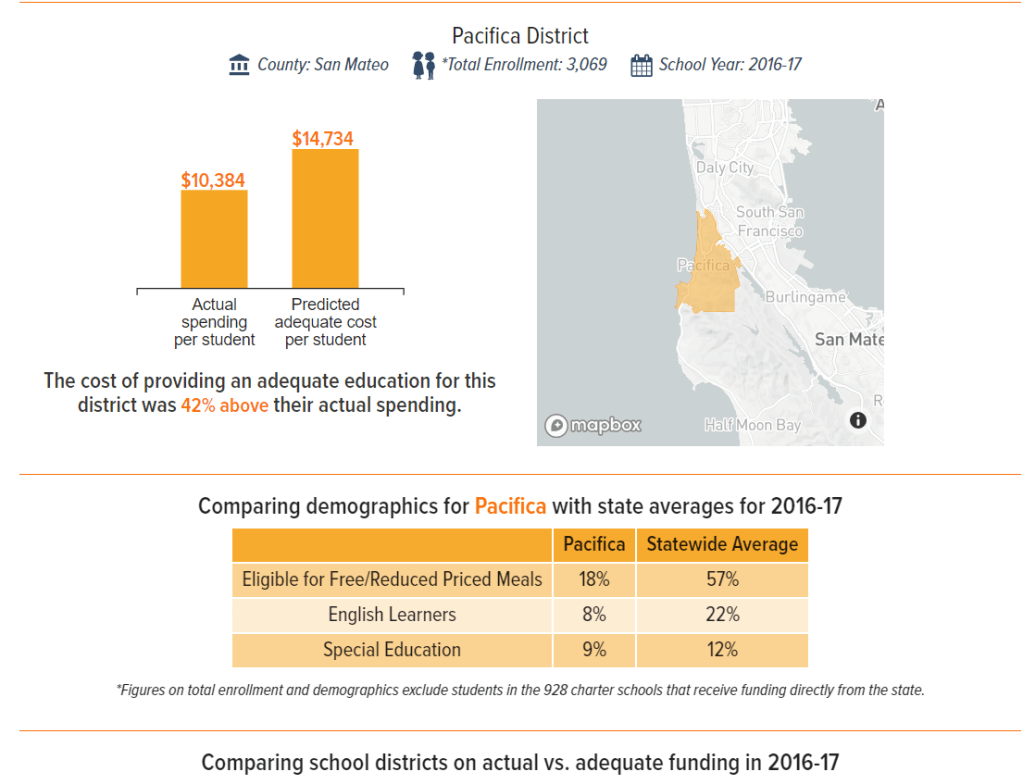
According to this tool, Pacifica School District would need to receive 42% more funding in order to provide an adequate education. Bear in mind that this web site is using data from 2016-17, and that the costs of education are probably even higher now.
Pacifica is hardly alone in being significantly below the amount of school funding needed to provide an adequate education. Here is a graph of all of the elementary school districts in San Mateo County:
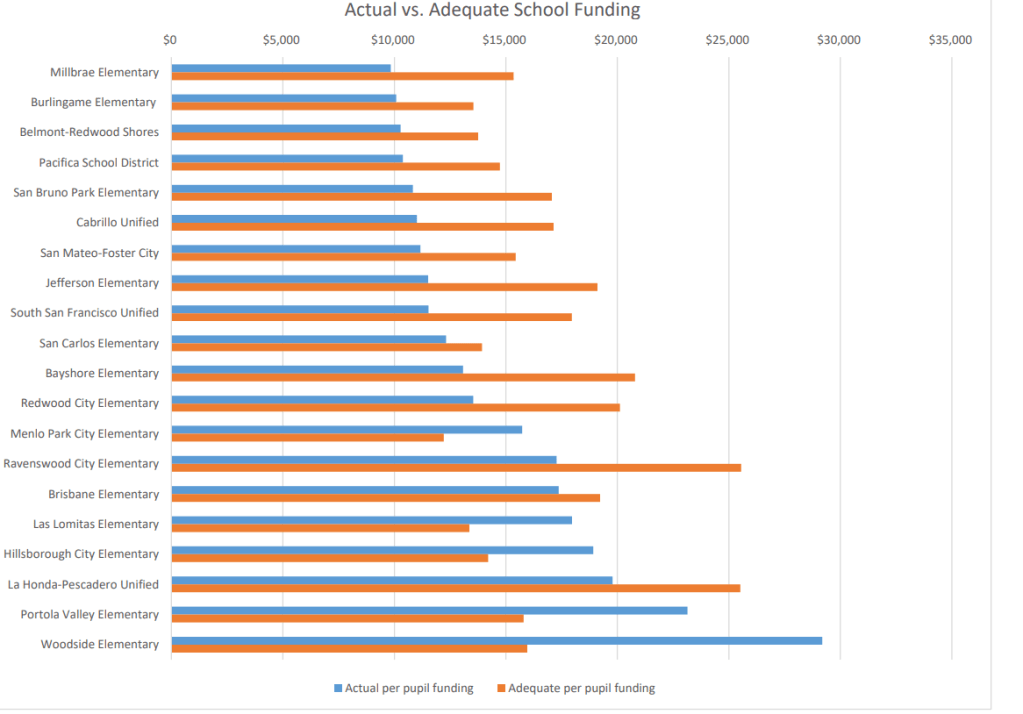
As you can see, only Menlo Park City Elementary, Las Lomitas Elementary, Hillsborough City Elementary, Portola Valley Elementary, and Woodside Elementary have Actual Funding (the blue line) that exceeds their Adequate Per Pupil Funding (the orange line). These are all high property-value school districts (called basic aid or revenue limit districts) which are not funded by the Local Control Funding Formula, because the amount they pay in property tax is higher than the amount required to fund their schools, and they are allowed to keep the excess. But even some of the revenue limit districts, like Brisbane and Belmont-Redwood Shores, are underfunded. And all of the LCFF-funded districts are well below the adequate funding amount.
Now that you have the tools to understand how much funding your school district receives, and how much it would need to provide an adequate education, we hope that you will contact your state legislators and tell them that you would like more funding for your schools and for every California school that does not have enough to meet the needs of its students.
