A common misconception about school funding is that it comes directly from local property tax, but the truth is more complicated.
The website ED100.org offers a detailed explanation of where school funding comes from, including this graph:
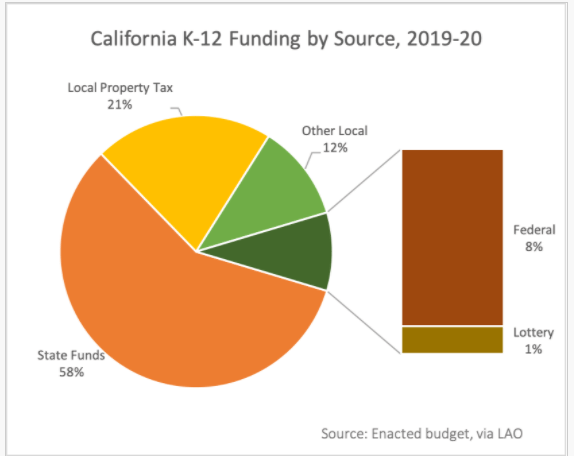
As you can see, local property taxes only provide 21% of the funding for California K-12 schools. In 1978, the passage of Proposition 13 prevented property value assessments from increasing more than 2% a year. This meant that most school districts were no longer able to meet their funding needs with their local property tax alone, so the state stepped in provide the extra money. As the graph above shows, 58% of the education budget now comes from the state. State funds come primarily from income tax, which is far less stable than property tax, and can change radically from year to year depending on the economy.
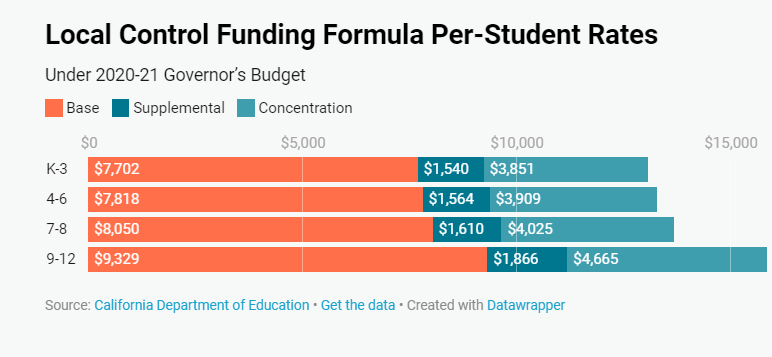
In 2013, California shifted from a complicated system of distributing school funds, to something called the Local Control Funding Formula (LCFF). This meant that each school district was given a set amount (called a base grant) for each student. Here’s Ed100’s 2019-2020 chart of how the base grant is allocated for different grade levels:

In addition to the base grant, school districts receive 20% more per student for each student classified as high needs (English language learners, or in poverty or foster care). This is called supplemental funding.
School districts with a large number of high needs students also receive concentration funding, which means that if more than 55% of the students qualify as high needs, the state will provide 150% of the base grant amount for each student over the 55% threshold. Here’s a chart from ED101 showing how high concentrations of high needs students can impact a district’s total funding:
What does this mean for school districts like Pacifica?
Although the Local Control Funding Formula established a standard way of allocating money to each school district, there is still tremendous inequity from district to district across the state.
The most startling differences in school funding are seen in community-funded districts (also know as basic aid districts). These are school districts in communities with high property values, where the revenue from property tax is higher than the base amount required by the state (called the revenue limit). The school districts in these communities are allowed to keep the excess property tax money for their own schools, meaning that their students sometimes receive 2 or 3 times as much funding as students in other districts.
Given that the students in these high-property wealth (community-funded) districts tend to be less needy, the funding accommodation that allows them to keep their excess revenues is a recipe for gross inequity.
Take for example, the percentage of high needed students from three school districts in our own county of San Mateo: the Pacifica School District (an LCFF-funded, or revenue limit district), and Woodside and Portola Valley School Districts (both community-funded).
| District | % of Students Qualifying for Free and Reduced Price Meals (FRPM) | % of English Learners | “Unduplicated” (% of FRPM-eligible, English Learners, or Foster Youth) |
| Pacifica | 20.5% | 10.8% | 26.17% |
| Portola Valley Elementary | 8.2% (-60%) | 4.5% (-58%) | 11.1% (-57%) |
| Woodside Elementary | 9.1% (-56%) | 5.1% (-53%) | 10.8% (-59%) |
The table shows that in the 2018-2019 school year, Pacifica had just over one in five students who were eligible for Free and Reduced Price Meals (FRPM), just over one in ten who was not fluent in English (English Learners), and just over one quarter who were FRPM eligible or English Learners or foster youth (a category called Unduplicated, which is used to provide funding adjustments to the Local Control Funding Formula). Portola Valley and Woodside each had less than half the number of students in these high-needs categories than Pacifica did. For example, the numbers in parentheses show that Portola Valley had 60% less FRPM-eligible students than Pacifica.
Despite the stark differences in student needs, Pacifica School District received far less funding to support learning compared to the two community-funded districts. Specifically, the chart below generated from California Department of Education data shows that Pacifica School District received $11,330 in funding on a per-pupil basis in 2018-19. In comparison, Woodside Elementary and Portola Valley Elementary received $31,603 and $30,529 per-pupil, respectively (equal to 179% and 169% more), despite serving less than half the incidence of students in need.

But even without factoring in the considerable inequities between revenue-limit and community-funded districts, there is still tremendous variability in funding across the state.
The Local Control Funding Formula Does Not Consider Cost of Living Differences
One problem is that the LCFF does not factor in the differences in the costs faced by school districts to hire and retain staff in various parts of the state, which are closely related to the cost of living in these areas. According to EdData, the revenue received from LCFF sources for the Pacifica School District is $9,006 per student, while the base grant for Bakersfield is $11,075, even though the cost of living is 52.5% higher in Pacifica.
In more concrete terms, the average rent for a 2 bedroom apartment in Pacifica costs $3,020 a month, compared to $1,070 a month in Bakersfield. However, our state school funding system does not take this into account. As this article from Jennifer Bestor of Educate our State points out, the failure to factor in differences in regional costs impacts ten high-cost counties, including San Mateo County, that together make up 36 percent of California’s population, and account for 46 percent of all property tax and 54 percent of all income tax.
California School Funding is Among the Lowest in the Country
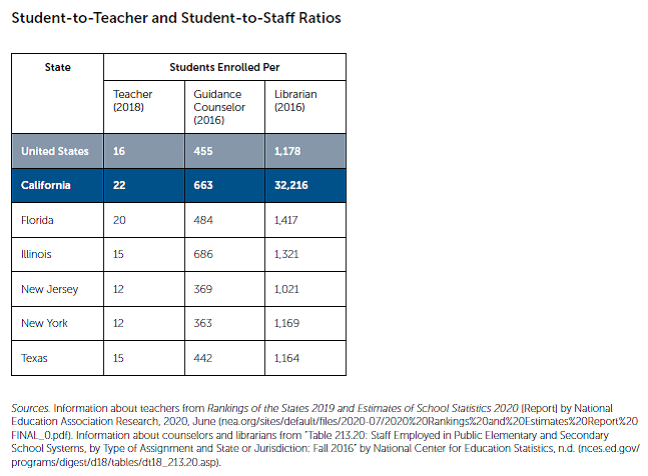
Aside from the inequities in funding between school districts, there is the underlying fact that school funding across the state is among the lowest in the country. According to the California Budget and Policy Center, in 2015-2016 California ranked 41st in the nation in terms of per pupil spending. Unsurprisingly, this low level of funding has led large differences in school staffing compared to other states. As shown in the table below, the ratios of students to teachers, guidance counselors and librarians are all higher (in many cases alarmingly so) than in many other states.
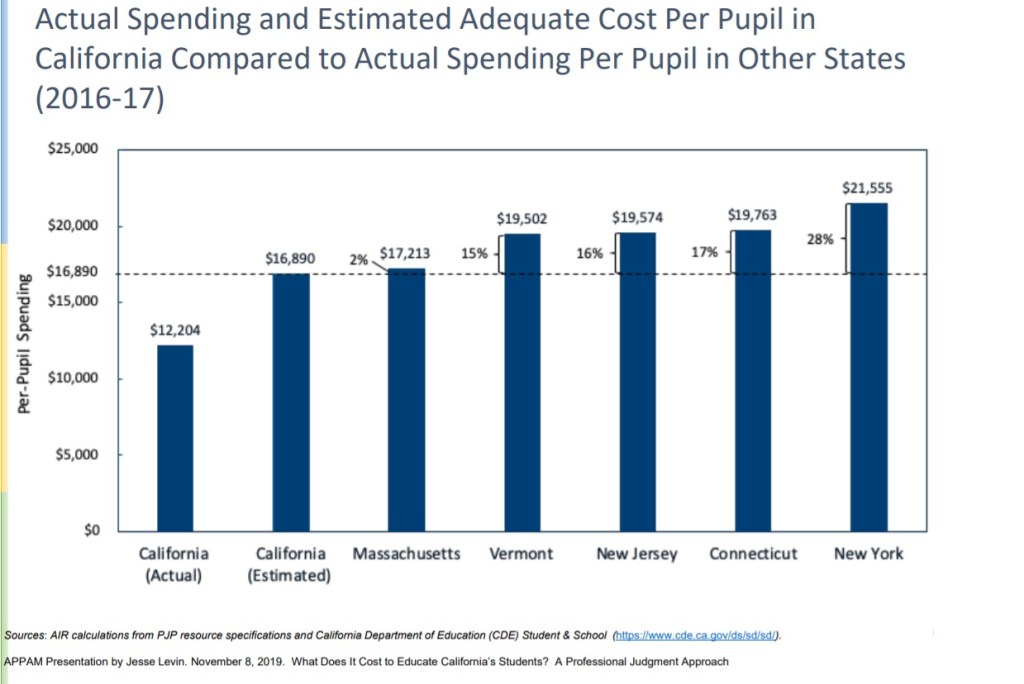
A 2018 investigation by Jesse Levin and colleagues of American Institutes for Research calculated the amount necessary to provide an adequate educational opportunity (defined as meeting the states academic and content standards) for all students in California public schools. The first two columns in the chart below shows that in 2016-17 statewide funding would have to increase by 38% (from $12,204 to $16,890 per student) to allow for this opportunity. While this suggested funding increase may seem large, in the context of what other states are spending it is not all that surprising. The chart further compares the actual spending and necessary funding per pupil in California to the actual per-student funding in other several states, which was often considerably higher.
Where Do We Go From Here?
There are many other factors that add to the increasing budget crisis facing California schools, including the rising costs of special education, and the increasing costs of state pensions (called the “Silent Recession), along with the uncertain impact of the COVID-19 pandemic on the state economy. But the two biggest obstacles to providing equitable and adequate funding for all California students are
- The current school funding formula does not account for regional differences in the cost of hiring and retaining staff.
- The basic amount of funding allocated for California students is too low.
The best way to get involved in the effort to provide equitable school funding across the state is to advocate for measures that address these two problems. You can do this by contacting your state legislators and other representatives to share your concerns, and by supporting movements like the Educate Our State imPACT campaign and the California School Board Associations Full and Fair Funding campaign. Please visit our News & Resources page for more ways to help.
